I can’t be any more blunt than this, if you’re not incorporating variability into your mine scheduling, you’re not producing a good mine schedule – it’s as simple as that! I wouldn’t have written three articles stressing the impacts of variability on mine scheduling if I didn’t think it wasn’t one of the biggest issues in mine scheduling. As far as I’m concerned, it’s in the top two problems with scheduling.
So it naturally follows then that I think mine scheduling should be carried out using stochastic scheduling, rather than deterministic scheduling. Just so we’re clear on terminology, by stochastic scheduling (also called probabilistic scheduling), I mean that the schedule has ranges built into the completion times for activities. Whereas deterministic scheduling is the use of single-point calculations for activity times, with no ranges in the assumptions (as discussed in Article 7).
Stochastic scheduling is not possible without the right scheduling software and I’m going to call on software providers to help out here with their expertise. I’m not associated with any software providers and so don’t have a detailed knowledge of the capabilities of any current mine scheduling software platforms. But as a potential user of stochastic scheduling software, I would categorise mine scheduling software into three capabilities, as follows:
- Simple – the software displays the probability of an overlap between two activities and therefore that one activity will be delayed. However, there is no modification (delay) to any activity start times, even when there is an overlap of the activities.
- Delayed – when there is an overlap between activities, the software delays the latter activity until the first task is completed. This is more realistic than the Simple option, as this first delay may have follow on effects in later interactions and cause secondary delays, it is critical to understand those.
- Resequenced – in the third option, when there is an overlap between activities, the software reschedules the delayed equipment to another location so that it does not sit idle. This option is the closest to reality, as most mines would reschedule equipment rather than have it sit idle. However, the ability to reschedule requires the software to have rules to apply and a very smart algorithm to use in determining how to change the schedule.
As I’m not affiliated with any software providers, I’d love for them to provide commentary as to which of the above three options their software is capable of, or if there is another option I’ve missed, let me know. I have not written these articles to facilitate the sales of software, but I am serious about the need for change in mine scheduling, so it is appropriate that I educate decision-makers as to the impacts of variability and facilitate potential solutions to be put in front of them. I am convinced that if you want your mine scheduling to improve, then it needs to incorporate variability. So it would be great to see discussions around software with those capabilities.
And so, what should you do if you don’t currently have stochastic capability software and it’s not on the radar for your mine to install? Then at a minimum, you should be thinking about building a manual version of the “Simple” option from above. If you take any interaction between two activities, with knowledge of the activity variabilities, it is possible to determine the probability of one activity being delayed by the other.
You know I love simplistic examples to try and help in explaining, here’s another one! In Figure 1 below, we show the variability on two activities, blasting of Block B is planned to finish on Day 15 and it has a standard deviation that is 40% of the task length (not unrealistic from real data calculations). Excavation is digging Block A and is planned to complete that Block on Day 20 before then commencing excavation of Block B (which has just been blasted). It also has a standard deviation of 40% of the task length. (Note I have assumed normal distributions for both activities, but as per this previous article, it is more likely that both curves will be right-skewed.)
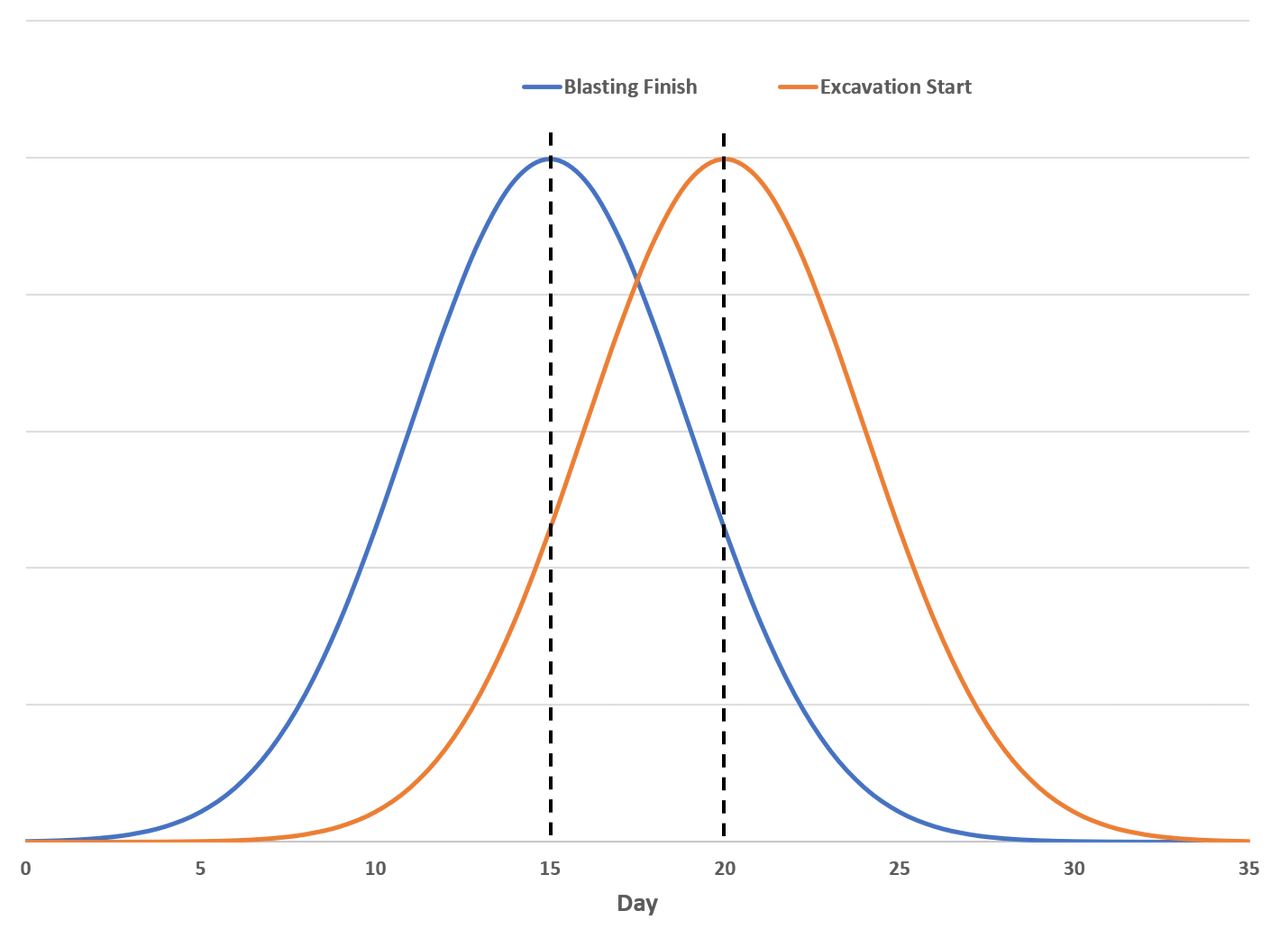
Figure 1 – Activity Interaction
These 2 activities have a 5 day float (or lag) between them, which is also not uncommon in the mining industry. But as you can see, there is a large degree of overlap between the two curves. That overlap represents the probability that there will be a schedule conflict, which means that the excavation activity will not be able to start as blasting is not finished. Figure 2 shows that the overlap, in this case, works out to be a 27% probability that excavation will be ready to start before blasting has finished and therefore will have to wait for the blast.
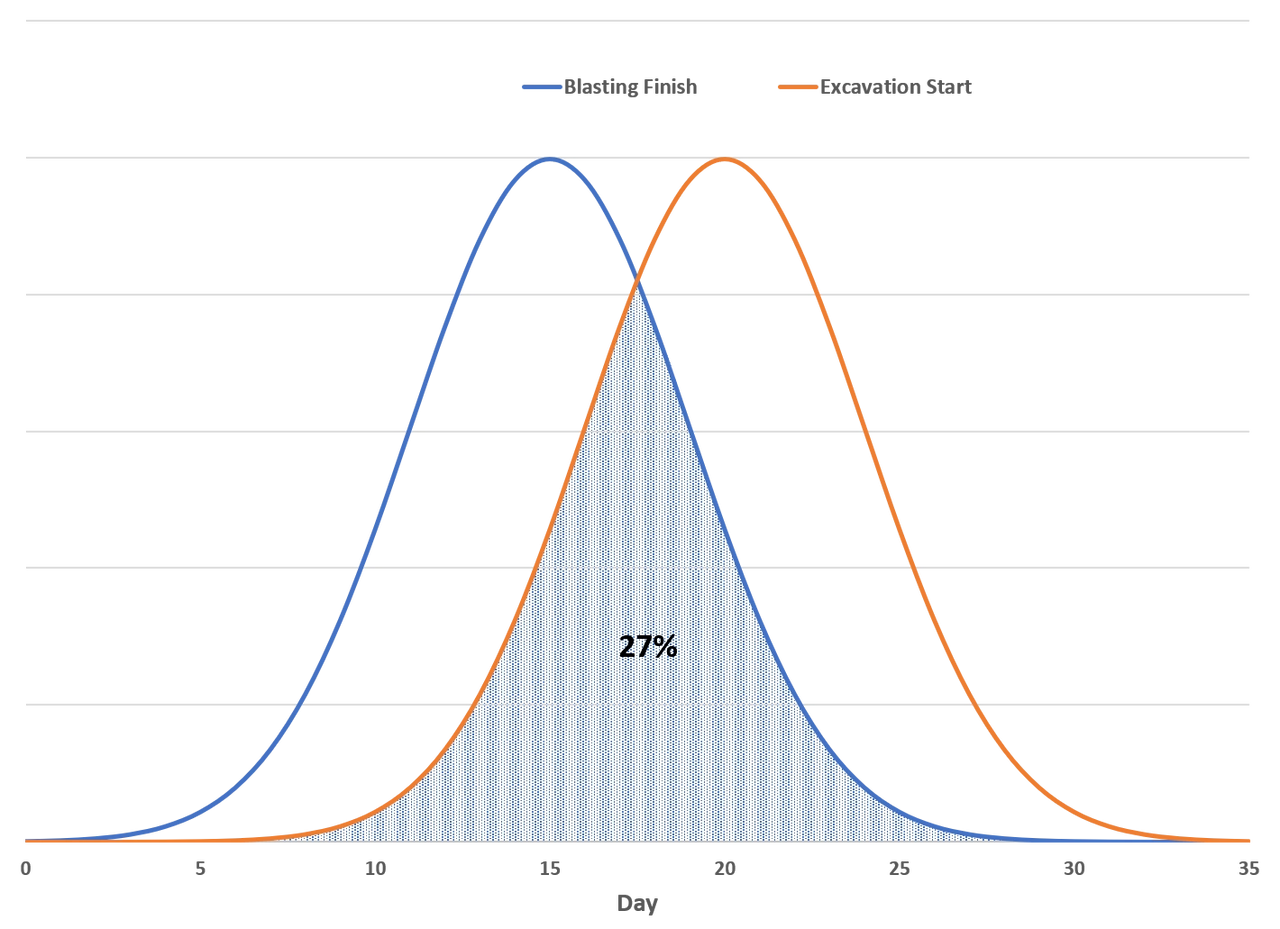
Figure 2 – Delay Probability
I would suggest that for the most critical interactions in the mine schedule it would be worth carrying out this exercise to understand the probability of there being a schedule conflict. It would be relatively simple to set up some spreadsheet templates with historical variability distributions and then just use the planned lag from the schedule that is being tested.
With this tool, it is also possible then to carry out further analysis to understand how sensitive the interaction is to changes in the schedule. For example in this scenario, if the lag between activities was only 2 days instead of 5, then the probability of excavation having to wait on blasting increases to 40%. But, if the lag was 8 days instead, then the probability reduces to 16%. If you want the interaction probability to reduce to below 10%, the planned lag has to be 11 days or longer.
There is a worthy set of work incorporating this last set of logic into creating targets for float between activities when scheduling. What risk of interaction between activities are you prepared to accept? This then allows you to determine the target minimum lag times to use between activities when scheduling.
And how do you decide which interactions in the schedule will likely have the highest probability of an overlap? Here’s a method that will provide a very good indication of where to start with your calculations. Divide the lag between two activities, by the average standard deviation of those two activities. The lower this number, the higher the likelihood of there being a schedule conflict.
There it is, even if you can’t source a software tool capable of incorporating variability into your mine schedules, you now have the logic to create a simple tool that allows you to understand the inherent risk in your schedule. The lower the risk, the longer the life of the schedule (before it is wrong), and the greater the likelihood of being able to successfully implement the plan. More on de-risking your mine schedules in the next article…………….
This article is the tenth in a series of articles on various issues and topics relating to mine scheduling. If you found this article beneficial, you can always go back to the first article here and read through the series in order.
For other articles like this and quality conversations on a range of mining engineering subjects, I’d encourage you to join the LinkedIn Group called MinErs Digs, click here.